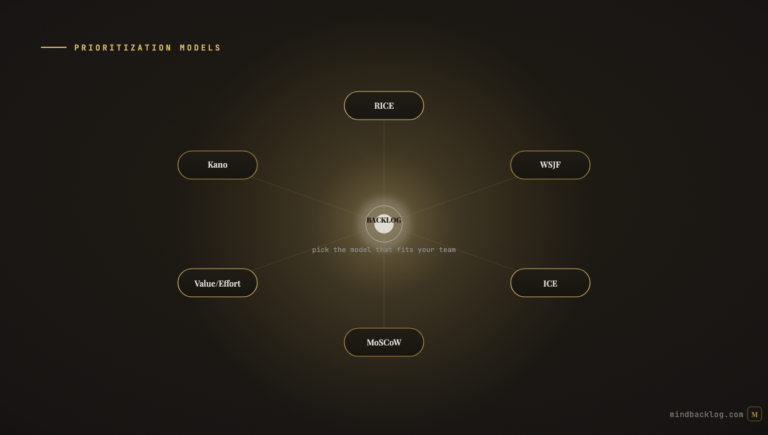
WSJF — Weighted Shortest Job First — is the prioritization framework that consistently outperforms simpler methods for teams making economic decisions about feature investment. Where RICE gives you a general-purpose score and MoSCoW gives you a categorical bucket, WSJF gives you an economically optimal ordering: the sequence of features that maximizes the total value delivered per unit of time invested. This matters because development capacity is the most expensive and most constrained resource in any product organization, and the order in which you consume that capacity has enormous financial implications.
Despite its power, WSJF is frequently misapplied. Teams score components in isolation rather than relative to each other. They conflate time criticality with importance. They underestimate job size for complex features. And they skip the relative estimation technique that makes the framework accurate. This guide walks through the formula step by step, with a complete worked example and scoring rubrics that eliminate the ambiguity that undermines most WSJF implementations.
The Formula
WSJF = Cost of Delay ÷ Job Size. Cost of Delay is itself the sum of three sub-components: Business Value + Time Criticality + Risk Reduction (or Opportunity Enablement). This means the full formula is: WSJF = (Business Value + Time Criticality + Risk Reduction) ÷ Job Size.
The formula produces a unitless ratio. Higher numbers indicate higher priority. The interpretation is intuitive: features with high value and small size score highest (quick wins with big payoffs), while features with low value and large size score lowest (expensive bets with uncertain returns). The formula naturally penalizes large, low-value features and rewards small, high-value ones — which is exactly the economic behavior you want from a prioritization framework.
Component 1: Business Value
Business Value captures the direct economic benefit of delivering the feature. This includes revenue generation (new sales, upselling, contract expansion), cost reduction (operational efficiency, support ticket reduction), and customer value (retention improvement, satisfaction increase). The question to ask: ‘If we deliver this feature successfully, what is the positive business impact?’
Score using relative estimation on a modified Fibonacci scale (1, 2, 3, 5, 8, 13, 20). Start by identifying the feature with the lowest business value in the set being scored and assign it a 1. Score every other feature relative to that baseline. If Feature B provides roughly five times the business value of the baseline, it scores 5. If Feature C provides roughly thirteen times the value, it scores 13. The absolute numbers do not matter — only the relative proportions.
Scoring rubric: 1-2 = minor efficiency improvement or cosmetic enhancement. 3-5 = meaningful productivity or retention benefit for a defined user segment. 8-13 = significant revenue or retention impact affecting a substantial portion of customers. 20 = company-defining capability that creates major competitive advantage or unlocks a new market.
Component 2: Time Criticality
Time Criticality captures how urgently the feature must be delivered. Some features lose value if delayed. A regulatory compliance requirement with a hard deadline is maximally time-critical — it loses all value after the deadline passes. A nice-to-have UI improvement has zero time criticality — delaying it by a quarter does not diminish its value. The question to ask: ‘What happens to this feature’s value if we delay it by one quarter?’
This is the component most commonly confused with importance. A feature can be extremely important but not time-critical. Conversely, a feature can be moderately important but highly time-critical (a contractual deadline, a competitive response window, a seasonal opportunity). Time criticality is about the cost of delay specifically, not the absolute value of the feature.
Scoring rubric: 1-2 = no time pressure, value is stable regardless of when delivered. 3-5 = some competitive pressure or opportunity window, but no hard deadline. 8-13 = specific external deadline or rapidly closing competitive window. 20 = immovable deadline where the feature has zero value if not delivered by a specific date.
Component 3: Risk Reduction / Opportunity Enablement
This component captures secondary strategic value beyond direct business impact. Risk Reduction includes addressing technical debt that threatens system stability, closing security vulnerabilities, ensuring compliance with evolving regulations, and reducing dependency on fragile components. Opportunity Enablement includes building platform capabilities that unlock multiple future features, establishing partnerships that create distribution advantages, and creating data assets that compound in value over time.
The question to ask: ‘Beyond its direct value, does this feature reduce a meaningful risk or create significant future opportunity?’ A feature that addresses a critical security vulnerability scores high on risk reduction even if its direct business value is modest. A feature that creates an API platform scores high on opportunity enablement because it enables an ecosystem of integrations.
Scoring rubric: 1-2 = minimal secondary value, no significant risk reduction or opportunity creation. 3-5 = addresses a known risk or creates a modest future opportunity. 8-13 = significantly reduces a high-probability risk or enables a strategically important capability. 20 = eliminates an existential risk or creates a transformative platform opportunity.
Component 4: Job Size
Job Size is the denominator — the estimated effort required to deliver the feature. It is scored on the same relative Fibonacci scale as the other components. Identify the smallest feature in the set and assign it a 1. Score everything else relative to that baseline.
Common mistake: estimating job size in hours or days rather than relative to other features. The absolute effort does not matter for WSJF — only the relative effort. A feature estimated at 3 weeks and a feature estimated at 6 weeks might both score 5 and 8 on the job size scale if other features in the set are smaller or larger.
T-shirt sizes map to Fibonacci for convenience: XS=1, S=2, M=3, L=5, XL=8, XXL=13. If your team estimates features using T-shirt sizes, the mapping is direct.
Worked Example: 5 Features Scored
Feature A — Analytics Dashboard Redesign. Business Value: 8 (broad customer impact). Time Criticality: 2 (no deadline pressure). Risk Reduction: 2 (no significant risk addressed). Job Size: 8 (large project). WSJF = (8+2+2)/8 = 1.50.
Feature B — SOC 2 Compliance Updates. Business Value: 5 (enables enterprise deals). Time Criticality: 13 (audit deadline in Q3). Risk Reduction: 8 (compliance risk). Job Size: 5 (medium effort). WSJF = (5+13+8)/5 = 5.20.
Feature C — Search Performance Fix. Business Value: 5 (addresses top complaint). Time Criticality: 5 (competitor just shipped). Risk Reduction: 3 (minor stability improvement). Job Size: 2 (small fix). WSJF = (5+5+3)/2 = 6.50.
Feature D — Mobile App v2. Business Value: 13 (new market segment). Time Criticality: 3 (no hard deadline). Risk Reduction: 5 (reduces desktop dependency). Job Size: 13 (very large). WSJF = (13+3+5)/13 = 1.62.
Feature E — API Rate Limiting. Business Value: 3 (infrastructure). Time Criticality: 8 (stability incidents increasing). Risk Reduction: 13 (prevents outages). Job Size: 3 (focused work). WSJF = (3+8+13)/3 = 8.00.
Priority order: E (8.00), C (6.50), B (5.20), D (1.62), A (1.50). The API rate limiting and search fix — both relatively small efforts with high urgency — outrank the large Analytics redesign and Mobile app despite those features having higher business value. This is WSJF’s core insight: it favors high-value, right-sized work that can be delivered quickly, maximizing the total value delivered per unit of capacity consumed.
How AI Supercharges WSJF Scoring
WSJF’s biggest challenge is the subjectivity of the input scores. AI addresses this by pre-populating scores with evidence-based estimates. For Business Value, AI analyzes the volume and customer-value weighting of linked feedback signals. For Time Criticality, AI detects urgency language in customer feedback and competitive pressure from monitoring data. For Risk Reduction, AI assesses technical complexity indicators and dependency relationships. For Job Size, AI compares against historically completed features of similar scope.
The PM reviews and adjusts these AI-generated scores, but the starting point is evidence-grounded rather than opinion-driven. This makes WSJF sessions faster (the analytical work is pre-done) and more reliable (the inputs reflect comprehensive data rather than selective memory).
| MindBacklog calculates WSJF scores automatically using AI that analyzes your customer signals, competitive data, and team velocity. Evidence-based inputs. Defensible priorities. Start your free trial at mindbacklog.com. |
Ready to put your product intelligence on autopilot? Start your 14-day free trial at MindBacklog.com — no credit card required.