Gantt charts have a reputation problem in the product management community. They are associated with waterfall planning, false precision, and project managers who care more about the timeline than the outcome. Many modern PM thought leaders actively discourage their use, advocating instead for flexible formats like now-next-later boards or outcome-based roadmaps.
This advice is well-intentioned but overbroad. Gantt charts are not the right tool for every context, but they remain indispensable in specific, common situations that alternative formats cannot adequately serve. The key is knowing when a timeline view adds genuine value versus when it creates false expectations — and leveraging modern AI capabilities that make Gantt charts dramatically more useful than they were in the pre-AI era.
When Gantt Charts Are Essential
Three situations make timeline visualization necessary rather than optional. The first is hard external deadlines. When a feature must ship by a regulatory compliance date, a contractual commitment, or a partner launch window, the timeline is not a suggestion — it is a constraint. Gantt charts make these constraints visible and enable the team to plan backward from the deadline, identifying the latest possible start date and any slack in the schedule.
The second is cross-team dependencies. When Feature A cannot begin until Feature B is complete, and Feature B is owned by a different team, the temporal relationship must be visualized. Now-next-later boards show priority order but not temporal dependencies. Gantt charts show both, with visual connectors that make blocking relationships immediately apparent.
The third is resource planning across multiple concurrent features. When a single engineering team is responsible for three features on the roadmap, the PM needs to see how those features overlap in time, whether the team is over-allocated in any period, and where gaps exist for smaller work items. This temporal resource view is what Gantt charts were designed for.
The AI-Enhanced Gantt: Predictive Timeline Visualization
The traditional Gantt chart’s biggest weakness is that it shows planned timelines, which are often wrong. Initial estimates are optimistic, scope evolves during development, and the chart becomes a fiction that the PM must manually update as reality diverges from the plan.
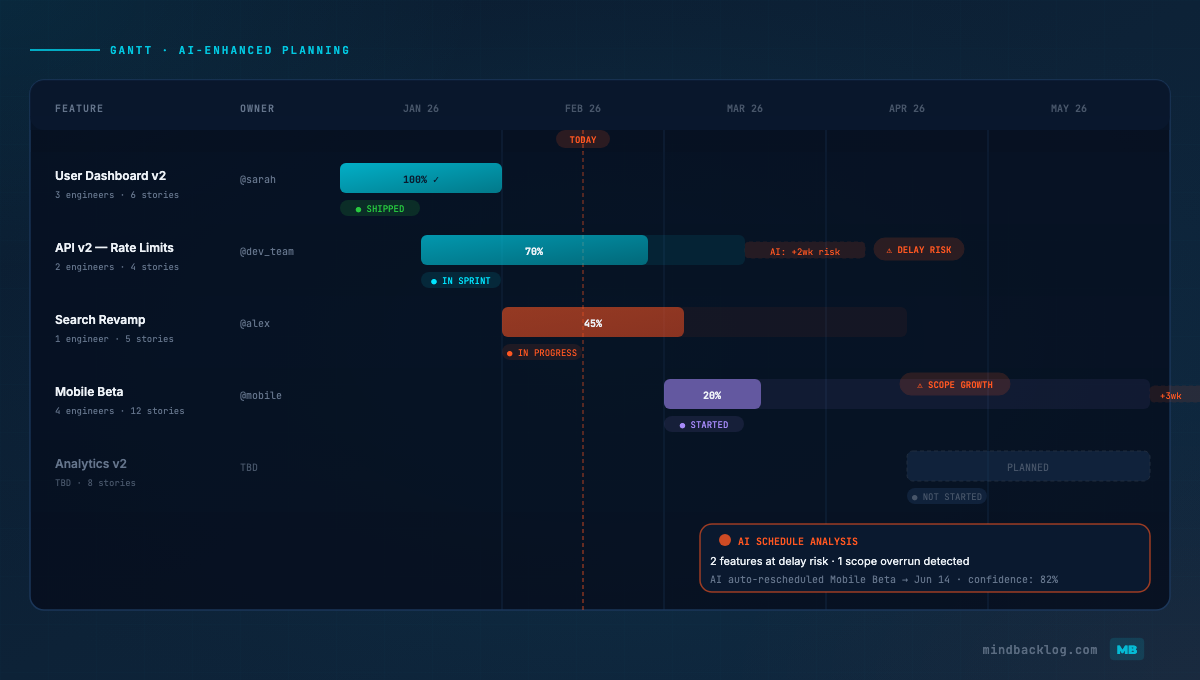
AI-enhanced Gantt charts solve this with predictive timeline overlays. The concept works as follows: the original planned timeline is displayed as a solid bar. As development progresses and real velocity data becomes available — either from the built-in tracker or synced from an external tool like Jira — the system calculates a predicted completion date based on remaining work and current team velocity. This prediction is displayed as a dotted extension (or contraction) from the end of the solid bar.
When the dotted bar extends significantly beyond the solid bar, it is a visual early warning of scope creep or estimation error. The PM can see at a glance which features are on track (dotted bar within the solid bar), which are at risk (dotted bar slightly exceeding), and which need intervention (dotted bar far beyond the original plan). This transforms the Gantt from a static plan into a dynamic monitoring tool.
Dependency Visualization
Features rarely exist in isolation. A new search improvement might depend on a database migration that another team is handling. A new reporting feature might be blocked by an API update that is still in development. These dependencies create scheduling constraints that are invisible in list views and kanban boards but immediately apparent in a Gantt chart.
Modern Gantt implementations display dependencies as visual connectors — arrows from the blocking feature’s end date to the blocked feature’s start date. When a blocking feature slips, the downstream impact is visually obvious: every feature in the dependency chain shifts accordingly, and the PM can immediately see the cascade effect of a single delay.
Common Gantt Traps to Avoid
The Gantt chart becomes counterproductive when it is used as a communication tool for audiences that should not see dates. External stakeholders — customers, board members, non-product executives — will interpret dates as commitments regardless of how many caveats you attach. For these audiences, use a now-next-later or outcome-based format that communicates priority without implying specific dates.
Another trap is over-granularity. A Gantt chart that shows individual user stories rather than features becomes unreadably dense and requires constant updating. Keep the Gantt at the feature level. Sprint-level and story-level planning belongs in the development tool, not the roadmap timeline.
The third trap is treating the Gantt as immutable. The timeline should be a living view that reflects current reality, not a historical document. AI-powered prediction helps here: the chart automatically updates based on actual progress, reducing the manual maintenance that causes traditional Gantt charts to fall out of date.
Stakeholder-Specific Timeline Views
The most effective approach is maintaining the Gantt as an internal planning tool while deriving stakeholder-specific views from the same underlying data. Engineering sees the full Gantt with dependencies, team assignments, and predictive overlays. Product leadership sees a simplified Gantt showing major milestones and strategic themes. External stakeholders see a non-dated outcome roadmap generated from the same feature data but without temporal commitments.
This multi-view approach — one source of truth, multiple presentations — gives each audience the information they need without exposing details that would be misleading or counterproductive. The Gantt is the operational truth. Other views are derived from it for communication purposes.
|
MindBacklog’s Timeline View delivers a modern Gantt with dependency visualization, team assignments, and evidence-linked features. See what you’re building, when, and why — backed by customer signals. Start your free trial at mindbacklog.com. |
Ready to put your product intelligence on autopilot? Start your 14-day free trial at MindBacklog.com — no credit card required.