There is a persistent myth in product management that meaningful analytics requires a data engineering team, a data warehouse, and SQL expertise. This myth keeps many PMs — especially at startups and small companies — operating without quantitative product data, making decisions based on qualitative feedback alone. The reality in 2026 is that no-code analytics tools have matured to the point where a PM can set up essential product metrics in a single afternoon without writing a line of code.
The goal is not to replace a data team. It is to ensure that every PM has access to the five essential analytics views that inform product decisions — regardless of whether their company has dedicated data resources. These five views cover the entire user lifecycle and provide the quantitative foundation that qualitative feedback alone cannot.
The Five Essential Views
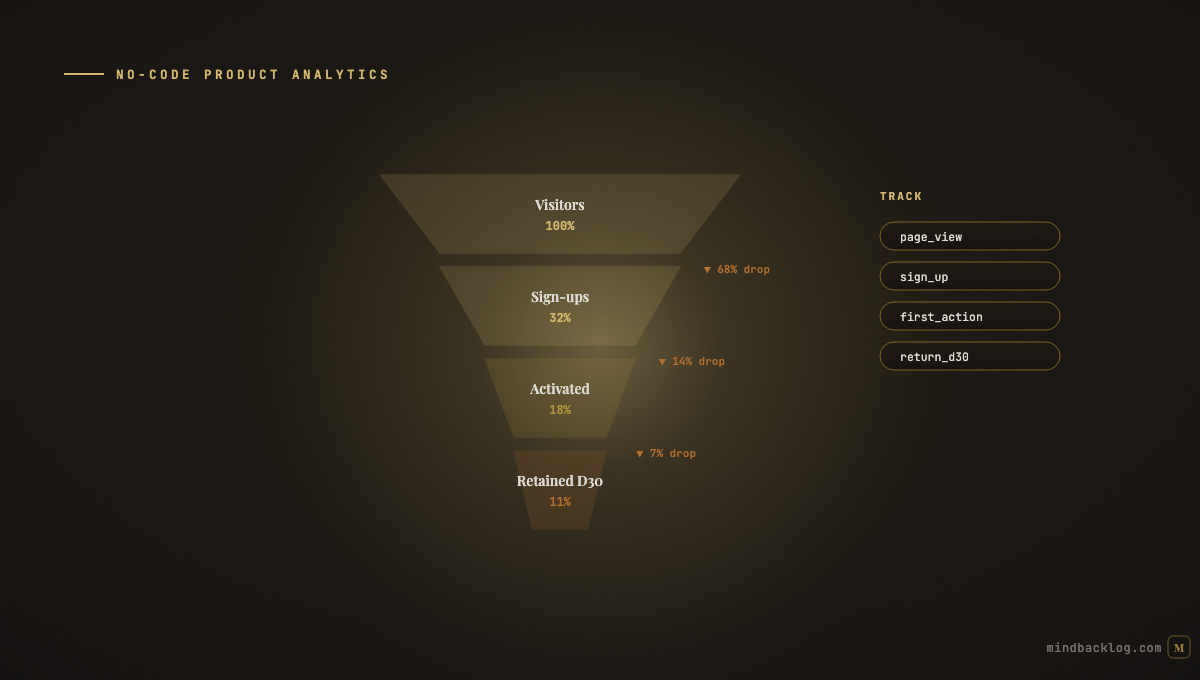
View one: the Activation Funnel. This tracks the percentage of new users who complete each step of the onboarding journey — from signup through account creation, first key action, and value realization. Drop-off at each step indicates where the onboarding experience is losing users. Most no-code analytics tools (Amplitude, Mixpanel, PostHog) build funnels from predefined events with a visual editor.
View two: Weekly Retention Cohorts. This shows the percentage of users from each signup week who return in subsequent weeks. Healthy retention curves flatten (users stick around). Unhealthy curves decline continuously (users leave). Comparing cohorts over time reveals whether product changes are improving or degrading retention.
View three: Feature Adoption by Segment. This shows which features are being used, by which user segments, and at what frequency. Features with low adoption need investigation: is the feature hard to discover, hard to use, or not useful? Segmenting by user type reveals whether a feature serves its intended audience.
View four: Feedback Volume Trend. This tracks the volume of customer feedback over time, segmented by channel and type. Rising feedback volume may indicate growing engagement or growing frustration — the sentiment analysis determines which. This view connects quantitative feedback data with the qualitative signals in your feedback pipeline.
View five: NPS or Satisfaction Over Time. This tracks customer satisfaction at regular intervals, segmented by user cohort or customer tier. Declining satisfaction in a specific segment is an early warning of churn risk that should trigger investigation and prioritization response.
Setting Up Without Engineering
The initial setup of analytics events typically requires engineering support — someone needs to instrument the key events (signup, first action, feature usage) in the application code. This is usually a one-time investment of a few hours. Once the events are flowing, the PM can configure dashboards, funnels, cohorts, and segments independently using the analytics tool’s visual interface.
Start with a minimal event set: ten to fifteen events covering the key moments in the user lifecycle. Resist the temptation to track everything — excessive events create noise, increase storage costs, and make it harder to identify meaningful patterns. You can always add events later as specific questions arise.
Connecting Analytics to Feedback
Analytics data becomes most powerful when connected to qualitative feedback. A declining activation rate tells you there is a problem. Customer feedback signals tell you what the problem is. Together, they provide both the urgency (from the metric) and the diagnosis (from the signals) that drive effective product responses.
AI-powered product management platforms can surface these connections automatically — correlating feedback themes with metric movements. When onboarding-related signals increase at the same time activation rate drops, the system flags the correlation. The PM does not need to manually cross-reference two data sources. The intelligence pipeline connects them.
| MindBacklog tracks your feedback pipeline health with built-in analytics — signal volume by channel, processing throughput, and evidence depth per feature. Combine with your product analytics for the complete picture. Start at mindbacklog.com. |
Ready to put your product intelligence on autopilot? Start your 14-day free trial at MindBacklog.com — no credit card required.