What gets measured gets managed, and most product teams measure almost nothing about their feedback process. They track product metrics — activation, retention, revenue — but treat feedback management as an operational task that either happens or does not, with no quantitative assessment of how well it is working. This blind spot means that feedback pipeline problems — missed signals, slow processing, poor consolidation, broken feedback loops — go undetected until they manifest as bad product decisions.
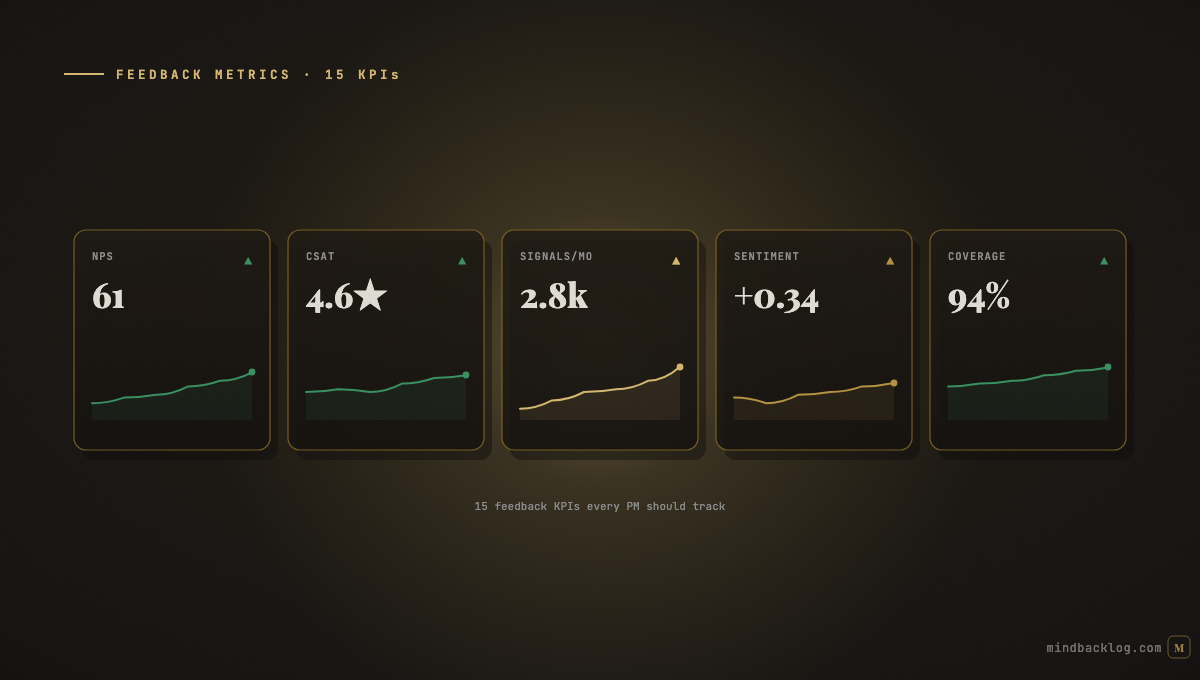
Tracking feedback metrics is not about creating another dashboard for its own sake. It is about ensuring that the intelligence pipeline that informs your product decisions is healthy, improving, and delivering on its potential. These fifteen KPIs cover the full feedback lifecycle — from collection through processing, consolidation, prioritization, and loop closure.
Collection Metrics (Are You Hearing Enough?)
KPI 1: Feedback Volume by Channel measures the total signal count per channel per period. This tells you whether each channel is active and productive. A channel showing declining volume may indicate a technical problem (the channel is broken), a customer behavior shift (they are providing feedback elsewhere), or a perception problem (they do not believe feedback leads to action). Track weekly and compare against 4-week averages.
KPI 2: Channel Diversity Index measures what percentage of your total signals come from each channel. A healthy index shows signals distributed across multiple channels. If 90 percent of signals come from a single channel, your feedback picture is narrow and potentially biased. Target: no single channel exceeding 40 percent of total volume.
KPI 3: Unique Submitter Count tracks how many distinct customers or users are providing feedback per period. High volume from a small number of submitters indicates a vocal minority rather than broad customer engagement. Track monthly and segment by customer tier.
Processing Metrics (Is the Pipeline Healthy?)
KPI 4: Average Processing Time measures how long a signal takes from ingestion to fully classified and feature-linked. Real-time channels should complete processing in minutes. Batch channels should complete within the batch cycle plus processing time. Increasing processing time may indicate pipeline bottlenecks or scaling issues.
KPI 5: AI Classification Accuracy measures the percentage of AI classifications that are correct, based on PM override rate. If the PM overrides the AI’s classification on 15 percent of signals, the accuracy is 85 percent. Track monthly and investigate if accuracy drops below 85 percent — it may indicate a product context that needs updating.
KPI 6: Duplicate Detection Rate measures what percentage of incoming signals are identified as duplicates of existing feature ideas. A healthy rate (30-50 percent) indicates that the system is effectively consolidating related feedback. A very low rate may indicate under-detection. A very high rate may indicate that the same few issues dominate your feedback without resolution.
Consolidation Metrics (Is Evidence Building?)
KPI 7: Signal-to-Feature Conversion Rate measures what percentage of processed signals link to a feature idea (either automatically or manually). A healthy rate is 60-80 percent. Signals that do not link to any feature either represent noise that was correctly filtered, new needs not yet captured as feature ideas, or matching failures that need investigation.
KPI 8: Average Signals per Feature measures the evidence depth behind each feature idea. Features with high signal counts (20+) have strong evidence. Features with low counts (1-3) may be speculative. The distribution tells you how evidence-grounded your backlog is overall.
KPI 9: Cross-Channel Evidence Rate measures what percentage of feature ideas have signals from two or more different channels. Features validated across channels have stronger evidence than those supported by a single source. Target: 50+ percent of feature ideas with multi-channel evidence.
Prioritization Metrics (Are Decisions Evidence-Based?)
KPI 10: Score Coverage measures what percentage of features in your active backlog have a current AI Priority Score. Features without scores are being prioritized by opinion rather than evidence. Target: 100 percent of features in Ideas and Roadmap stages.
KPI 11: Score-Roadmap Correlation measures how well your roadmap order correlates with your priority scores. A high correlation means your roadmap reflects the evidence. A low correlation means factors outside the scoring framework are driving roadmap decisions — which may be appropriate (strategic bets) or problematic (HiPPO influence).
KPI 12: Objective Alignment Rate measures what percentage of roadmap features are linked to an active strategic objective. Features without objective links may be important but are not connected to the stated strategy. Target: 80+ percent of roadmap features linked to at least one objective.
Feedback Loop Metrics (Are Customers Heard?)
KPI 13: Acknowledgment Rate measures what percentage of customer-submitted feedback receives an acknowledgment within 48 hours. Target: 95+ percent for direct channels (web forms, email, portal).
KPI 14: Feedback Loop Closure Rate measures what percentage of customers who submitted feedback are notified when the related feature ships. This is the ultimate measure of whether your feedback process respects the customer’s investment of time and thought. Target: 80+ percent for identified submitters.
KPI 15: Feedback-to-Ship Time measures the average elapsed time from when a piece of feedback is received to when the related feature ships. This is a long-cycle metric but reveals whether the feedback process is influencing the product timeline or sitting disconnected from it.
Building Your Feedback Dashboard
You do not need to track all fifteen KPIs from day one. Start with the five most diagnostic metrics: Feedback Volume by Channel (are you collecting?), AI Classification Accuracy (is processing working?), Signal-to-Feature Conversion Rate (is consolidation working?), Score Coverage (is prioritization evidence-based?), and Feedback Loop Closure Rate (are customers heard?). Add the remaining metrics as your feedback practice matures.
|
MindBacklog tracks your feedback pipeline health automatically — signal volume, classification accuracy, evidence depth, and pipeline throughput are visible on the Dashboard. Monitor what matters. Start at mindbacklog.com. |
Ready to put your product intelligence on autopilot? Start your 14-day free trial at MindBacklog.com — no credit card required.